Over time, I have noticed that colleagues and friends have a passing interest and knowledge base regarding where we get our energy from and how we use it in the United States. Folks are interested in learning but are not sure where to look. Given this, we have decided to kick off an introductory series for those interested in learning more about energy, the players in the energy arena, energy policy both federal and state, and technology involving energy.
If you are a 301 or 401 student, this is NOT the place for you, even though you are always welcome.
The US energy mix (i.e., where we get our energy from and how we use it) is primarily composed of fossil fuels, with petroleum being the largest source (36%), natural gas being the second largest source (31%), followed by coal (13%), making up approximately 79% of total primary energy production; renewable energy sources like solar, geothermal, hydro and wind accounting for approximately 14% (but showing continued growth), with nuclear power also contributing approximately 7% to the source of power.
Sources focus on where our energy comes from. Uses focus on how energy is used.
Sources of Energy in the United States:
Petroleum is the top source of energy in the US, accounting for approximately 38% of total source energy; petroleum is primarily used in the transportation sector and the industrial sectors to run motor vehicles and equipment.
Natural gas is the second highest source of energy in the US, accounting for around 31% of total primary energy production; natural gas is primarily used in the industrial sector, the residential, commercial sectors and to a great degree in the creation of electricity.
Nuclear power is a significant contributor to electricity generation in the US.
Renewable energy growth – Renewable energy sources like solar, hydro, geothermal and wind are and have been continuing to increase their share in the US energy mix. Their use continues to increase and expand over time with increased creation being used in electric generation and industrial use for power.
Coal – while reducing in overall use as time marches on, coal continues to be used as a back up source of power to create electricity and commercial buildings as a source of heat.
The breakdown of what sources of energy are used to create electricity in the US are as follows:
- Natural gas: 43% – a naturally occurring fossil fuel found underground; used in electric power creation, industry, residential, commercial buildings, and transportation; production has increased 90% in the US since 2008; The power sector continues to be a huge consumer of natural gas.
- Renewable energy: 21% – includes hydroelectric, solar, wind as well as geothermal; in 2022, renewable energy generation surpassed coal as a source of energy for the first time in history; US electric production.
- Nuclear power: 19% – contributed nearly 20% of the electric power generated in the US; used to produce reliable, low-carbon energy;
- Coal: 16% – found underground in sedimentary deposits; continues to diminish in use even though a relatively cheap source of power given its impact on the workers who mine it and the air quality around areas that use it; nearly all coal that is mined in the US is used to create electricity; and
- Petroleum (crude oil): .4% – per Statista, petroleum is the primary source of energy in the US; it is a naturally occurring fossil fuel found underground; refined into gasoline, diesel, jet fuel and other fuels. The biggest use of petroleum products is in fuel for vehicles, planes and ships.
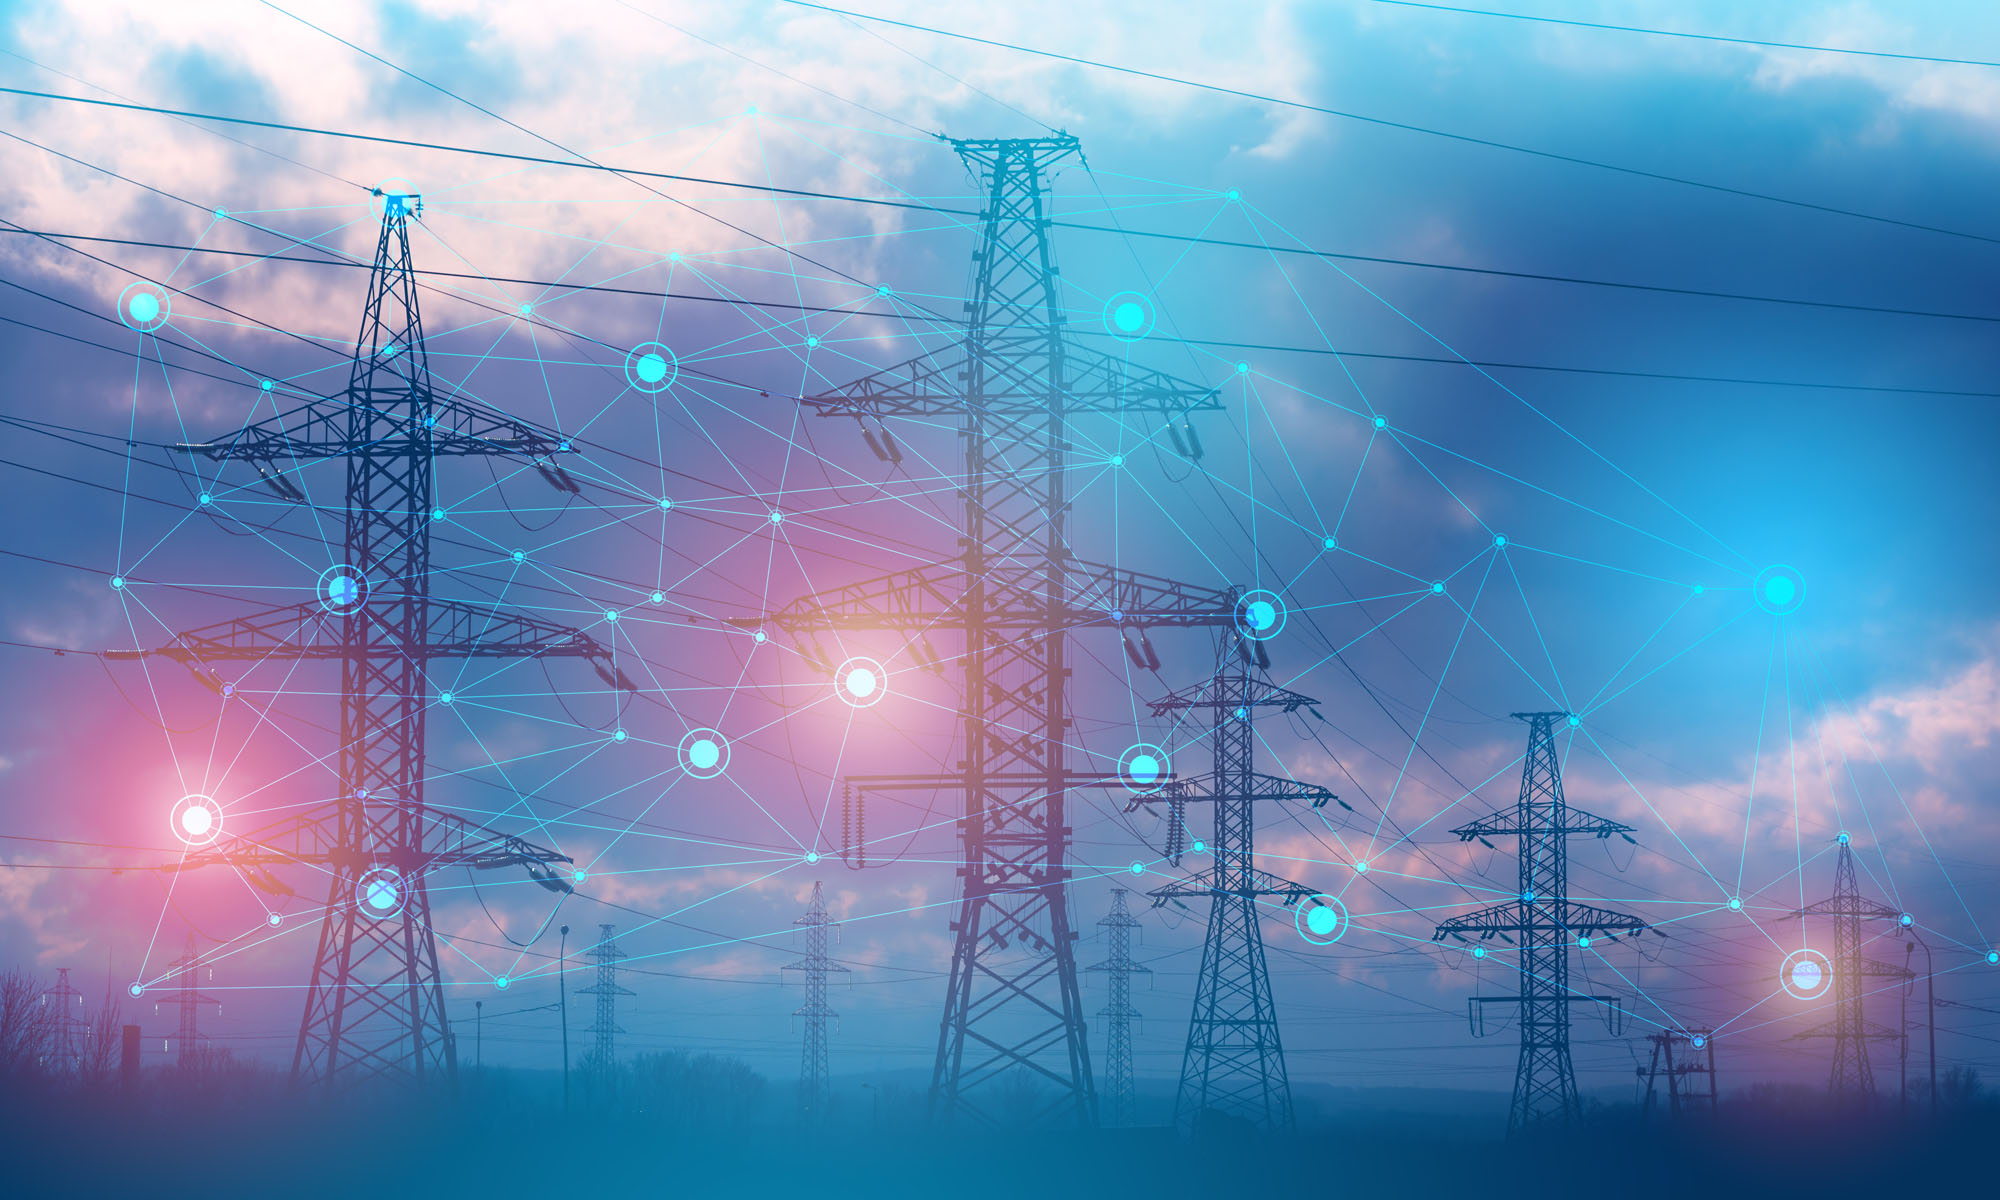
Electricity Generation –
- In 2023, approximately 4,178 billion kilowatt hours (kWh) (or about 4.18 trillion kWh) of electricity were generated at utility-scale electricity generation facilities in the United States[i]. About 60% of this electricity generation was from fossil fuels—coal, natural gas, petroleum, and other gases. About 19% was from nuclear energy, and about 21% was from renewable energy sources.
- The U.S. Energy Information Administration estimates that an additional 73.62 billion kWh of electricity generation was from small-scale solar photovoltaic systems in 2023.[ii]
- U.S. utility-scale electricity generation by source, amount, and share of total in 2023
| Energy source | Billion kWh | Share of total |
| Total – all sources | 4,178 | |
| Fossil fuels (total) | 2,505 | 60.0% |
| Natural gas | 1,802 | 43.1% |
| Coal | 675 | 16.2% |
| Petroleum (total) | 16 | 0.4% |
| Petroleum liquids | 12 | 0.3% |
| Petroleum coke | 5 | 0.1% |
| Other gases3 | 11 | 0.3% |
| Nuclear | 775 | 18.6% |
| Renewables (total) | 894 | 21.4% |
| Wind | 425 | 10.2% |
| Hydropower | 240 | 5.7% |
| Solar (total) | 165 | 3.9% |
| Photovoltaic | 162 | 3.9% |
| Solar thermal | 3 | 0.1% |
| Biomass (total) | 47 | 1.1% |
| Wood | 31 | 0.8% |
| Landfill gas | 8 | 0.2% |
| Municipal solid waste (biogenic) | 6 | 0.1% |
| Other biomass waste | 2 | 0.1% |
| Geothermal | 16 | 0.4% |
| Pumped storage hydropower | -6 | -0.1% |
| Other sources[iii] | 10 | 0.2% |
| Data source: U.S. Energy Information Administration, Electric Power Monthly, February 2024; preliminary data | ||
Electricity Consumption in the US:
After decades of flat electricity consumption, US energy demand is now projected to increase from between 24 to 29% by 2035, nearly twice the rate estimated in 2023. A combination of new investments in AI data centers, manufacturing, and broader electrification are the primary drivers behind this projected increase, with data centers accounting for 30% of the expected growth, according to a Goldman Sachs report in April 2024. One estimate suggests that data centers alone could consume 9% of total US electricity generation by 2030 (up from 4% today).
Energy Uses in the United States
There are generally five energy consuming sectors in the US:
- The industrial sector consumes approximately 35% of all energy consumption, including electricity; this sector includes facilities and equipment used for manufacturing, agriculture, mining, and construction. The largest contributor of power to this sector is natural gas.
- The transportation sector consumes approximately 37% of all energy consumption, including electricity; this sector includes vehicles that transport people or goods, such as cars, trucks, buses, motorcycles, trains, aircraft, boats, barges, and ships. Note that the lion’s share of petroleum uses are consumed in transportation related activities.
- The residential sector consumes approximately 16% of all energy consumption, including electricity; consists of homes and apartments.
- The commercial sector consumes approximately 12% of all energy consumption, including electricity and includes offices, malls, stores, schools, hospitals, hotels, warehouses, restaurants, and places of worship and public assembly.
- The electric power sector consumes primary energy to generate most of the electricity consumed by the other four sectors.
If you have additional energy topics you would like to see us explore, feel free to drop me a note at bamolotsky@duanemorris.com and we would be happy to add it to our growing list of things folks are asking for information about.
Duane Morris has a robust industry facing Energy and Environmental Group focused on incentives, regulatory, permitting, financing and development of energy projects internationally including renewables, solar, wind, geothermal and power purchase agreements and P-3 procurements. If you have any questions or follow ups, please do not hesitate to contact Brad A. Molotsky, Brad Thompson, Phil Cha, Shelton Vaughan or the lawyer in the firm whom you normally deal with on other matters.
[i] Utility-scale electricity generation is electricity generation from power plants with at least one megawatt (or 1,000 kilowatts) of total electricity generating capacity. Data is for net electricity generation. From USEIA data set.
[ii] Small-scale solar photovoltaic (PV) systems are electricity generators with less than one megawatt (MW) of electricity generating capacity, which are not connected at a power plant that has a combined capacity of one MW or larger. Most small-scale PV systems are at or near the location where the electricity is consumed and many are net metered systems. Smaller PV systems are usually installed on building rooftops or parking lots. From USEIA data set.
[iii] Other (utility-scale) sources includes non-biogenic municipal solid waste, batteries, hydrogen, purchased steam, sulfur, tire-derived fuel, and other miscellaneous energy sources. From USEIA data set.